In 2020 the CDC needed to put COVID-19 data in front of the public fast, and keep it current while the numbers changed, new data points were ingested, and processes changed every day. I led front-end development as well as the full stack of the COVID-19 Data Tracker on CDC.gov.
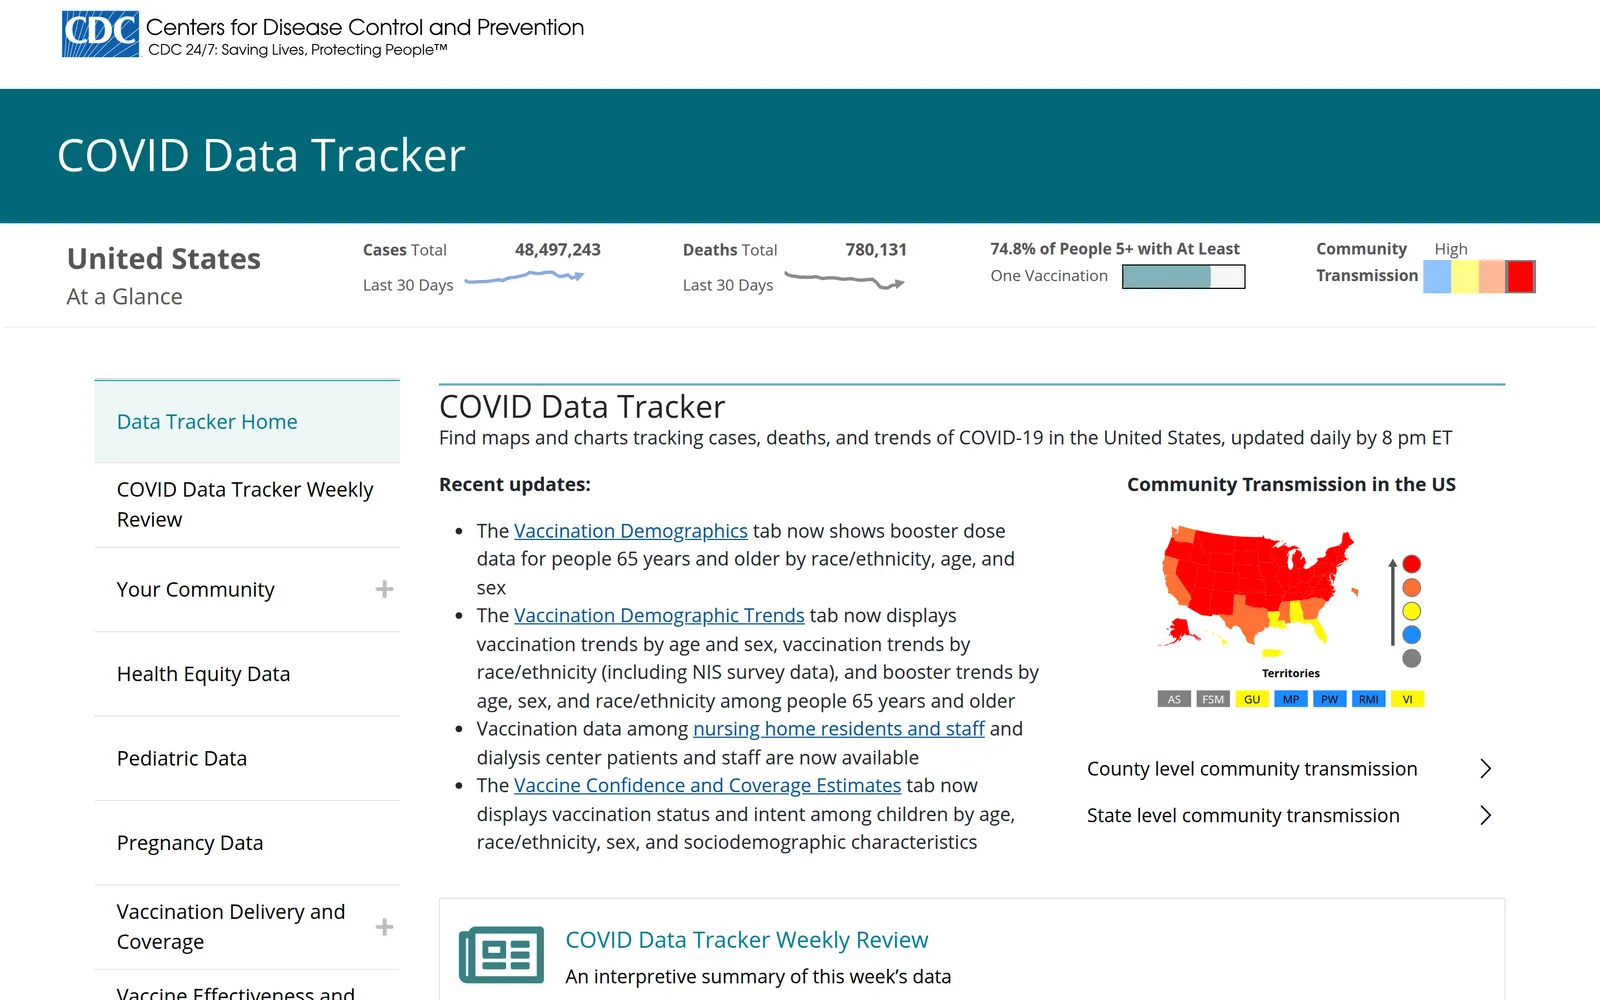
The tracker home page in December 2021
What I did
- Built the tracker’s public maps and charts, turning large public health data sets into views people could read at a glance.
- Built related tools for private government tracking on the same data.
- Built and mainteined the Node ingestion pipeline that turned raw state and county data into the clean feeds its data-viz ran on.
Why it mattered
For a long stretch, this was where a lot of people went to understand what was happening. The tracker’s home page alone logged over 71 million views across 2020 and 2021, enough to make CDC.gov’s ten most visited pages both years, and that’s before counting the maps and charts on every other tab.